Category Archives: Stock Market

Stock market news, analysis, and discussion

Organic Growth

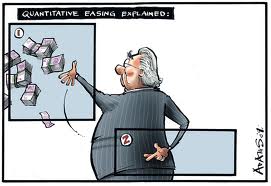
Image 1 for 4-14-14As you follow the economy over the next year, a key component to look for in earnings reports will be top-line, or revenue, growth. The reason this is important is that over the last several years, the market has been able to enjoy growth largely due to the Fed policy of Quantitative Easing. This policy has put cheap money into the system, and allowed corporations to take on huge amounts of cheap debt, while at the same time lowering the discount rate for those corporations and providing a somewhat artificial stimulus for stock price appreciation.

Image 2 for 4-14-14

Although this has boosted the market, and allowed consumers to feel wealthier because of investment appreciation, time will tell whether this strategy will truly boost consumer spending, which will be reflected in revenue growth. If we do see year-to-year growth in the top-line, it will support the fact that the economy is able to support itself organically, rather than relying on the Fed for stimulus.

Is The Market Rigged?

image 1 for 3-31


In a recent episode of 60 minutes, author Michael Lewis argued that the stock market is rigged. His argument was that High Frequency Traders (HFTs), who use computer algorithms and complex trading systems to buy and sell extremely high volumes of shares, are effectually robbing ordinary investors and anyone else who participates in the market.

What Is High Frequency Trading?

High Frequency Trading is:

A program trading platform that uses powerful computers to transact a large number of orders at very fast speeds. High-frequency trading uses complex algorithms to analyze multiple markets and execute orders based on market conditions. Typically, the traders with the fastest execution speeds will be more profitable than traders with slower execution speeds. As of 2009, it is estimated more than 50% of exchange volume comes from high-frequency trading orders.

High-frequency trading became most popular when exchanges began to offer incentives for companies to add liquidity to the market. For instance, the New York Stock Exchange has a group of liquidity providers called supplemental liquidityy providers (SLPs), which attempt to add competition and liquidity for existing quotes on the exchange. As an incentive to the firm, the NYSE pays a fee or rebate for providing said liquidity. As of 2009, the SLP rebate was $0.0015. Multiply that by millions of transactions per day and you can see where part of the profits for high frequency trading comes from.

The SLP was introduced following the collapse of Lehman Brothers in 2008, when liquidity was a major concern for investors.

How Can HFT Hurt Investors?

High Frequency Traders can hurt investors by, in effect, front-running buy and sell orders. When an order is taken, High Frequency Traders purchase the shares faster than you as the investor can, then sell them back at a small profit. Although the amount of profit made on each individual share may be minimal, when many shares are involved, these all add up to huge profits.

What To Do To Combat High Frequency Trading

First, to combat the effects of High Frequency Trading, become and remain a long-term investor. Day trading is a gamble not worth taking, and unless you are in on the high-frequency-trading-game, it is highly likely that you will lose at this pursuit. However, when you invest for the long-term, and have the patience and discipline to see your financial plan through to the end, you give yourself a great chance to be successful and make handsome profits.

Additionally, and on a more technical side, you can place limit orders on every share purchase. This is done by naming the top price you want to pay, per share, for a stock. This will allow the trader to not go above that price when making the purchase. For example, say a stock is trading somewhere in the neighborhood of $10.20/share. You can put a limit order of $10.25 on that stock, so that it will not be purchased above that price. As the stock price fluctuates throughout the day, it is likely that your order will be filled at the $10.25 price where your limit was set. This tactic will set your price, so that High Frequency Traders are not able to take advantage of you as the share price fluctuates throughout the day.
Stock Market Tennis Match

Best-Performing Assets Of 2014

image 1 for 3-27


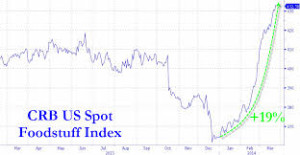
This chart says it all! One of the best-performing assets so far in 2014 is food. As the chart above shows, foodstuff is up 19% so far this year. This is largely the result of weather conditions over the past year, with severe winter weather in the East and a drought in California being the major contributors. If your wallet has been especially squeezed recently, this could be the reason why.

According to the U.S. Agriculture Department, consumers may want to get used to the squeeze, as record-high food prices are here to stay, at least for a while.

image 2 for 3-27


Which Way Is The Market Headed?

images (5a)


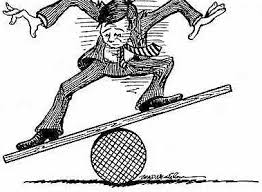
The above picture demonstrates how some market participants feel as they try to navigate the choppy waters of an unpredictable stock market. Both amateur investors and seasoned pros alike spend countless hours trying to make sense of it all, and with good reason. If you think about it, none of us are truly immune to the rises and falls of the market or the economy in general, as all of our futures (at least financially) are inextricably linked to the system in which we live, move, and have our being.

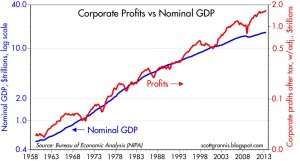
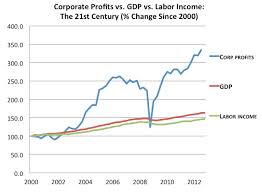
In my study recently, I came across an essay by a guy by the name of Chris Brightman. In this essay, Brightman covers the issue of corporate profits, which are at historic highs relative to both GDP and GNP. (Please see the chart below: Corporate Profits vs. Nominal GDP.) Brightman’s prediction is that moving forward, because things always revert back to the average, the market will falter, as corporations face political pressure to increase spending on labor, thereby decreasing their ability to put profits back into the corporation in the form of capital spending. (Please see the chart below: Corporate Profits vs. GDP vs. Labor Income.)

Profits vs Nominal GDP

images (5c)


However, columnist Sam Ro takes a contrarian viewpoint in a recent article in Business Insider called “Here’s What The Bears Get Dead Wrong About This Controversial Corporate Profits Chart.” In Ro’s view, the issue of corporate profits to GDP has been minimized in recent years as a result of the international exposure of corporations. Many corporations today accrue profits through their global constituents, and these numbers may not even enter the GDP equation. Ro ends his column by concluding that profit “margins are on a secular upswing thanks to increasing overseas exposure among other things.”

In closing, it is essential regarding your financial health to come to the realization that no one can accurately predict short-term movements in the stock market. The wisest and most profitable strategy is to choose a globally diversified portfolio of investments and then maintain discipline by staying the course for the long-term. Of course, the portfolio needs to be monitored and re-balanced regularly throughout the course of life, and you should certainly work with your financial adviser to accomplish this.


The January Effect

images (9)


The photograph above depicts, almost exactly, what the woods around my home have looked like for at least the last month, perhaps more. Long snowy days and prolonged frigid temperatures have made it seem as if the snow would never melt! In fact, it has only been within the last week that we have been able to walk on bare ground, rather than trudge through snow. Maybe this could be called the “January Effect,” at least upon the weather in my part of the world.

This extreme weather pattern brings to mind a supposed stock market phenomenon that some investors and market participants adhere to, called the January Barometer. This idea holds that market performance in January is a predictor of what the market will do for the rest of the year. Thinking about this as it relates to this past January would tend to scare off most investors, as the market tanked right at 3%!

However, a close look at historical data shows that the so-called January Barometer is not really, in itself, a great (or even good, really!) predictor of stock market yearly performance. In fact, when examined closely, the January Barometer tends to follow the same trend as other overly-simplistic theories which are often used in an attempt to explain the market.

The following quote is taken from Alex Rosenberg at cnbc.com. Rosenberg looks at data from the past 35 years, and says the following:

Going back to 1979, the S&P rose in 23 out of 35 Januarys. Over the next 11 months, the market consequently rose in 19 of those 23 years that were kicked off by winning Januarys—meaning that a positive January has successfully predicted a winning February-through-December 83 percent of the time.

But in the 12 years when the market fell in January, the market only followed along in four years. That’s just a 33 percent success rate.

The reason that positive Januarys prove to be a great barometer, and negative Januarys a terrible one, is the same reason that the “January barometer” appears to exist in the first place: Stocks rise.

So, as an investor or market participant, do not let your financial plan and goals be undermined by the negative weather or market conditions of a cold or down month in January. Take heart and stay disciplined, because as sure as rain falls in Scotland and the money supply in the US increases, stocks will also rise.